How Has the US Soybean Industry Done With the Trade War?
USDA is projecting the United States to become even more of a secondary player in the global soybean market over the next 12 months.
Based on the latest guesses, the US could export only 41% of what Brazil ships during the 2025-2026 marketing year.
This fits with what the market has been telling us since planting season this past spring.
To borrow a classic line from the television program Cheers, “(Bartender) How’s the US president’s trade war treating you US soybean industry? (US Soybean Industry) Like a baby treats a diaper.”
I know when I talk about real market fundamentals – the National Cash Indexes, Basis, Futures Spreads – I tend to lose a lot of you. After all, if it doesn’t come from a government report than most people in the industry don’t believe it can be real. Given this, I’m going to frame today’s discussion on the global soybean market using USDA’s latest WASDE numbers. And yes, I will scrub myself down with lye soap afterward to get rid of the stink and stain.
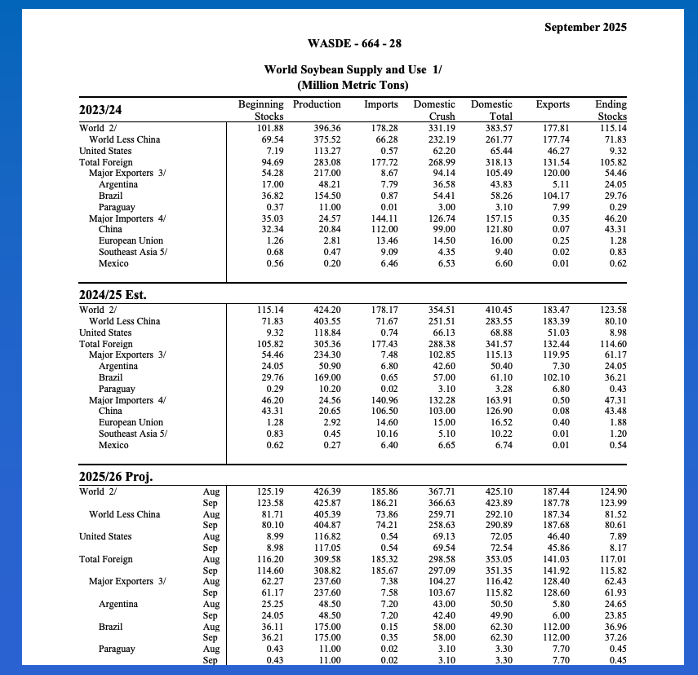
In the global update released last Friday (September 12) we find this set of soybean numbers:
- China is projected to import 112.0 million metric tons (mmt) during the 2025-2026 marketing year
- Unchanged from last month and up 5.5 mmt from 2024-2025 (reportedly)
- And tied with its largest import number from the 2023-2024 marketing year
- The latest guess for Brazil’s exports for the 2025-2026 marketing year also came in at 112.0 mmt, oddly enough
- Also unchanged from last month and up 9.9 mmt from 2024-2025 (reportedly)
- If realized, this would far outdistance Brazil’s previous record exports of 104.17 mmt from 2023-2024 (note how that fits with China’s record large import estimate)
- USDA estimated US exports at 45.86 mmt for 2025-2026
- Down 0.54 mmt from last month and down 5.17 mmt from 2024-2025 (reportedly)
- If realized this would be the lowest US export number for soybeans since 2019-2020’s 45.7 mmt
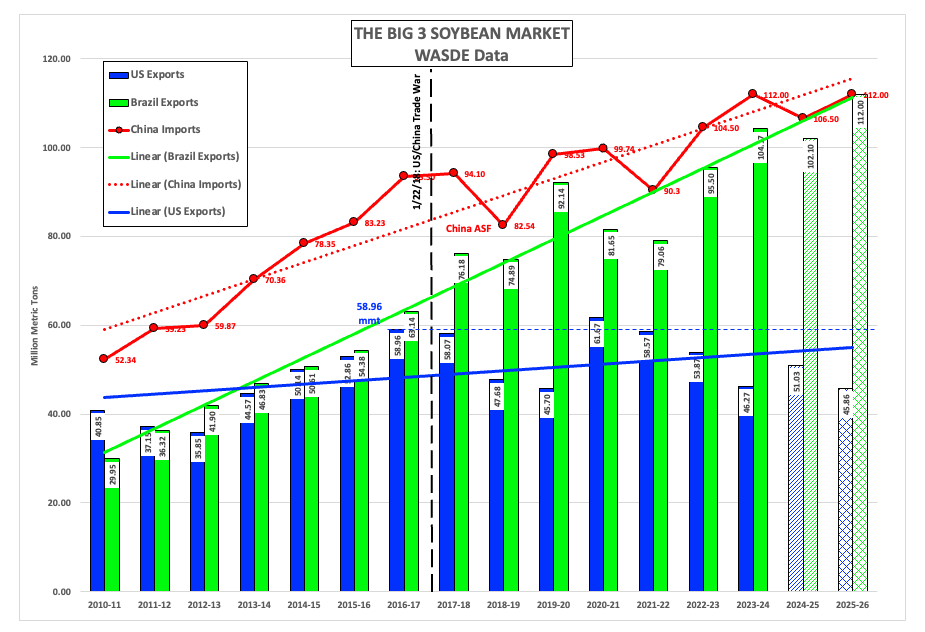
When we look at the history of what used to be the Big 3 Global Soybean Market, a few things are clear:
- During the 2014-2015 marketing year (September 2014 through August 2015) the world’s two largest suppliers were near even
- Brazil reportedly shipped 50.61 mmt while
- The US reportedly exported 1% less at 50.14 mmt
- All while China reported imported 78.35 mmt
- It was close again during the 2015-2016 marketing year with
- Brazil exporting 54.38 mmt
- And the US shipping 52.86 mmt, falling 3% behind
- While China increased its imports, reportedly, to 83.23 mmt
- Then came the US election of 2016 (November) during the 2016-2017 marketing year
- With Brazil reportedly shipping 63.14 mmt
- And the US 7% less at 52.86 mmt
- As China reportedly increased its imports again to 93.5 mmt
- We all know what happened next, as the US president followed through on what he said during the campaign and started a social media driven trade war with the world’s largest buyer of soybeans – China – in January 2018. During the 2017-2018 marketing year
- Brazil’s exports reportedly jumped to 76.18 mmt while
- US shipments dropped to 58.07 mmt, the first year-to-year decrease since 2012-2013
- While China’s imports again hit a new record high of 94.1 mmt
Since 2017-2018 there has been an ebb and flow, the global market influenced by weather (naturally) and a round or two of African Swine Fever. However, the trends remain clear:
- China’s demand has continued to go up over time
- Brazil’s exports have exploded, more than doubling over the past decade
- US exports have gone stagnant, the latest estimate putting US shipments 59% behind Brazil
What can be done for the US soybean industry? Nothing, at this point. It’s in Mother Nature’s hands.
- Again based on the September set of WASDE numbers
- The US 2025 production guess came in at 117.05
- Up 0.23 mmt from last month
- But down 1.79 mmt from last year (reportedly)
- Brazil’s 2026 production estimate came in at 175.0 mmt, a new record high
- Unchanged from last month
- And far outdistancing the record of 169.0 mmt set with the 2025 harvest
- The US 2025 production guess came in at 117.05
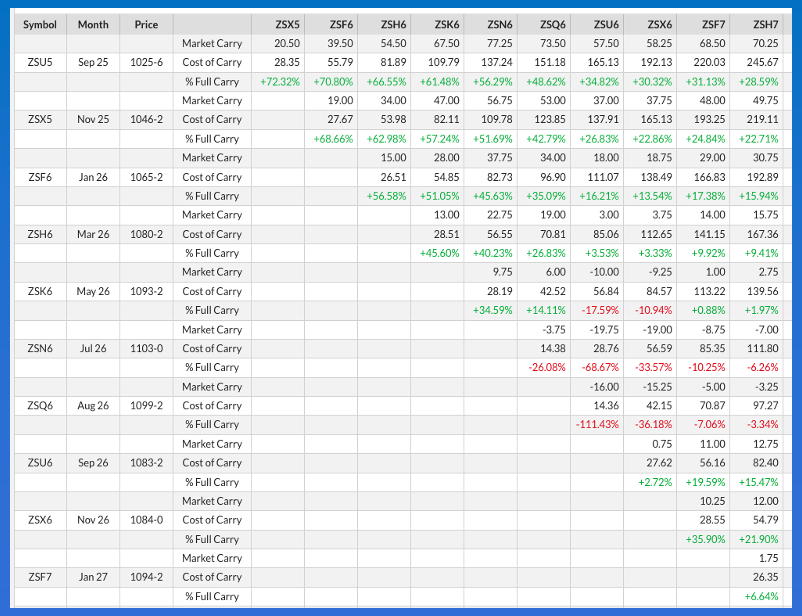
What is the market telling us through its futures spreads?
- The November-January futures spread (best read on US crop initial supply and demand) covered 69% calculated full commercial carry at last Friday’s close, a bearish level
- As compared to the last week of March settlement covering 37%
- And the same week the previous year covering 64% (second week of September)
- Meaning the commercial side of the market is more bearish this year than last
- While the November futures contract (ZSX25) shows little change (2025 versus 2024)
- The March-May futures spread (best read on Brazil’s initial new-crop supply and demand) covered 46% calculated full commercial at last Friday’s close, a neutral level
- As compared to the last week of March settlement covering 15%
- And the same week the previous year covering 48% (second week of September)
The bottom line is the market has been telling us the US 2025-2026 marketing year supply and demand situation has been growing more bearish, while the jury is still out on Brazil’s next crop.
On the date of publication, Darin Newsom did not have (either directly or indirectly) positions in any of the securities mentioned in this article. All information and data in this article is solely for informational purposes. For more information please view the Barchart Disclosure Policy here.